The mammalian heart consists of two pumps, connected to each other in series, so that the output from each is eventually applied as the input to the other. Since they are developed, embryologically, by differentiation of a single structure, it is not surprising that the pumps are intimately connected anatomically, and that they share a number of features. These include a single excitation mechanism, so that they act almost synchronously; a unique type of muscle, cardiac muscle, which has an anatomical structure similar to skeletal muscle, but some important functional differences; and a similar arrangement of chambers and one-way valves. Not surprisingly, the assumption has often been made that the function of the two pumps will also be similar. Thus it has become common practice to examine the properties of one pump, usually the left, and to assume that the results apply to the other also. This may often be unjustified, particularly in studies of cardiac mechanics, with the result that our knowledge of the mechanics of the right heart and the pulmonary circulation remains very incomplete. It must also be remembered that the scope for experiments on the human heart is very limited, and we must rely heavily on experimental information from animal studies. Thus the descriptions which follow apply primarily to the dog heart.
Many factors which affect the performance of the heart are not our concern in this chapter, among the most important being the wide range of reflexes which act on the heart. For example, nerve-endings in the aortic wall and carotid sinus are sensitive to stretch, and thus to changes in arterial pressure. A fall in arterial pressure, however caused, will reduce their frequency of initiation of nerve-impulses. This change, transmitted through nerves to the brain, alters activity in nerves passing to the heart, causing an increase in its rate and force of contraction. This in turn increases cardiac output and tends to restore the aortic pressure. A number of such reflexes, and a range of hormones reaching the heart via the bloodstream, are continuously modifying its performance in the intact animal, but since they are active physiological mechanisms, with origins outside the heart, we ignore them in this chapter. Thus no attempt is being made to provide a comprehensive description of normal cardiac function; only the muscular and mechanical features of cardiac pumping are explored.
The two pumps which make up the heart must operate over a wide range and be extremely well matched. Cardiac output in man may increase from a resting level of about 5 1 min-1 to 25 1 min-1 on strenuous exertion, and since we know that the ability of the pulmonary circulation to alter its volume (normally 0.5 - 1 l) is rather limited, the output of the two pumps must be the same except in the very short term.
The response of the heart in exercise involves an increase in rate of contraction and in output per beat (stroke volume). Thus the muscle fibres in the heart wall appear capable of varying both the time-course and the amplitude of their contraction, and it follows that the intrinsic contractile properties of cardiac muscle are of fundamental importance in any study of cardiac mechanics. They have, in the last twenty years, been the subject of intensive study, which was stimulated by the success of previous work on skeletal muscle in quantitatively describing the mechanical features of contraction. It has become clear that profound differences in functional properties exist which complicate the study (and the behaviour) of cardiac muscle, and different experimental methods and terminologies have added to the difficulties. Many interesting problems have emerged in translating the tension-generating and shortening properties of experimentally isolated slips of muscle into the pressure-generating and volume-ejecting properties of the intact ventricle, because the structure and geometry of the ventricle are complicated. Uncertainty about internal energy-losses in the muscle and the ordering and synchronicity of activation adds further difficulty here.
At the moment, therefore, although detail of the ultrastructure of the contractile apparatus is becoming available, our understanding of myocardial mechanics remains incomplete. The behaviour of the muscle is still described in terms of crude functional models, and the behaviour of the contracting heart-chamber can only be described qualitatively because of the geometrical uncertainties, even though the time-course and magnitude of the fluid-dynamic events in the cardiac cycle are being measured with increasing precision in both animals and man.
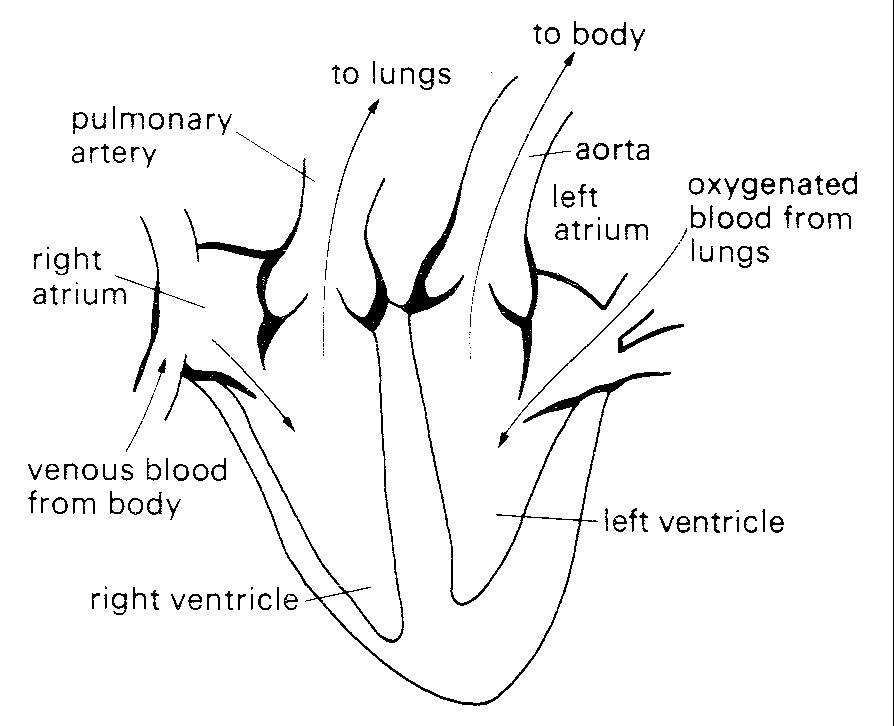
Each of the cardiac pumps consists of a low-pressure chamber (atrium), which is filled from a vein system and empties via a non-return valve into a high-pressure chamber (ventricle). The ventricle in turn passes blood on through a second non-return valve to an arterial system (Fig. 11.1).
Fig. 11.1. Diagrammatic representation of anatomy and directions of blood flow in the heart. septum. The veins draining into them communicate with them without valves.
The right heart receives blood from the body tissues via the systemic veins and pumps it into the pulmonary (lung) arteries. The left heart receives this blood from the pulmonary veins and pumps it into the systemic (main body) arterial circulation, via the aorta and its branches.
The two atria are comparable in structure; their walls are thin and relatively compliant, and they are separated from each other by a common wall, the atrial septum. The veins draining into them communicate with them without valves. The valves separating the atria from the ventricles (atrioventricular valves) differ slightly in structure on the two sides of the heart, the one on the right (tricuspid) having three cusps, the one on the left (mitral) two. These cusps consist of flaps, attached along one edge to a fibrous ring within the wall of the heart, and with free edges projecting into the heart-cavity. They are extremely thin (about 0.1 mm) and are made up largely of a meshwork of collagen and elastin fibres, covered by a layer of cells similar to those lining the walls of the heart-chambers and blood-vessels (the endothelium). The free edges of the cusps of both the mitral and tricuspid valves are 'tethered' to the wall of the respective ventricle by fine fibrous bands (chordae tendinae) which connect with slips of muscle (papillary muscles} projecting from the wall of the ventricle. Each chorda connects to the free edges of two cusps where they come in contact with each other when the valve closes; thus tension in the chorda generated by contraction of the papillary muscle at the beginning of systole counteracts the tendency of the increase in intraventricular pressure to turn the valve inside out and allow leakback into the atrium. There appears to be a self-contained mechanism for closure of these valves (see p. 232) in the flow events in late systole.
The exit valves from the ventricles (pulmonary and aortic) are very similar to each other, each consisting of three cusps with free margins reaching to the wall of the valve-ring. This arrangement allows opening to the full cross-sectional area of the valve-ring without distortion of the cusps. These cusps are not tethered, but can nonetheless support considerable pressure differences (in the case of the aortic valve, approximately 1.3 x 10⁴ N m-2 (100 mm Hg)). They are also extremely efficient, since only trivial backflow occurs through them during closure (which occurs more than 30 million times a year). Not surprisingly, their behaviour has been a source of interest for many years; in the fifteenth century Leonardo da Vinci examined their structure and made speculative drawings of flow patterns through them which have since proved remarkably realistic; their mechanism of action has recently been studied in detail (see p. 234).
The four valve orifices in the heart are aligned approximately in a single plane, and the cusps of each are attached at their bases to a stiff ring of fibrous tissue (Fig. 11.2).
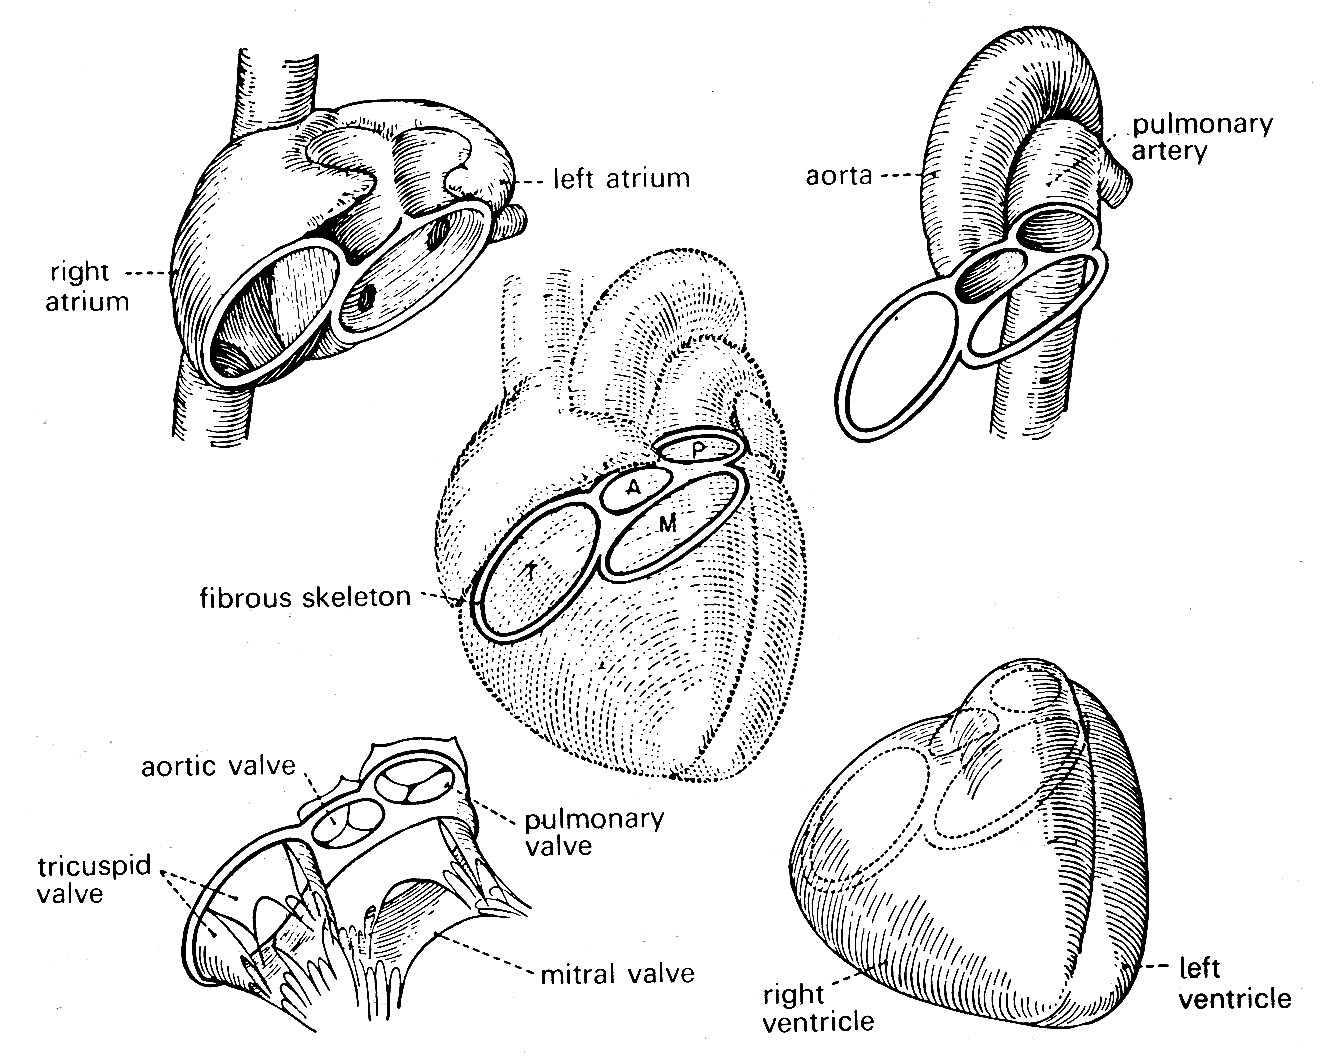
Fig. 11.2. Relationships of various structures in the heart. The 'skeleton' of the heart, consisting mainly of the fibrous valve-rings, also supports both atria and ventricles, and the two great arteries. (From Rushmer (1970). Cardiovascular dynamics. W. B. Saunders Company, Philadelphia.)
The four rings are in turn connected to each other by fibrous tissue so that the valve apparatuses are set in a stiff framework to which the muscle-fibres of each chamber are attached—the atria on one side, the ventricles on the other; and the pulmonary artery and aorta also attach at their origins to this plane of fibrous tissue. The whole heart is contained in a thin fibrous tissue bag, the pericardium, which in turn is attached to other structures within the chest, and through these to the vertebral column. The stress-strain relationship of the pericardium is, as can be inferred from Fig. 11.3, highly non-linear (Fig. 11.3).
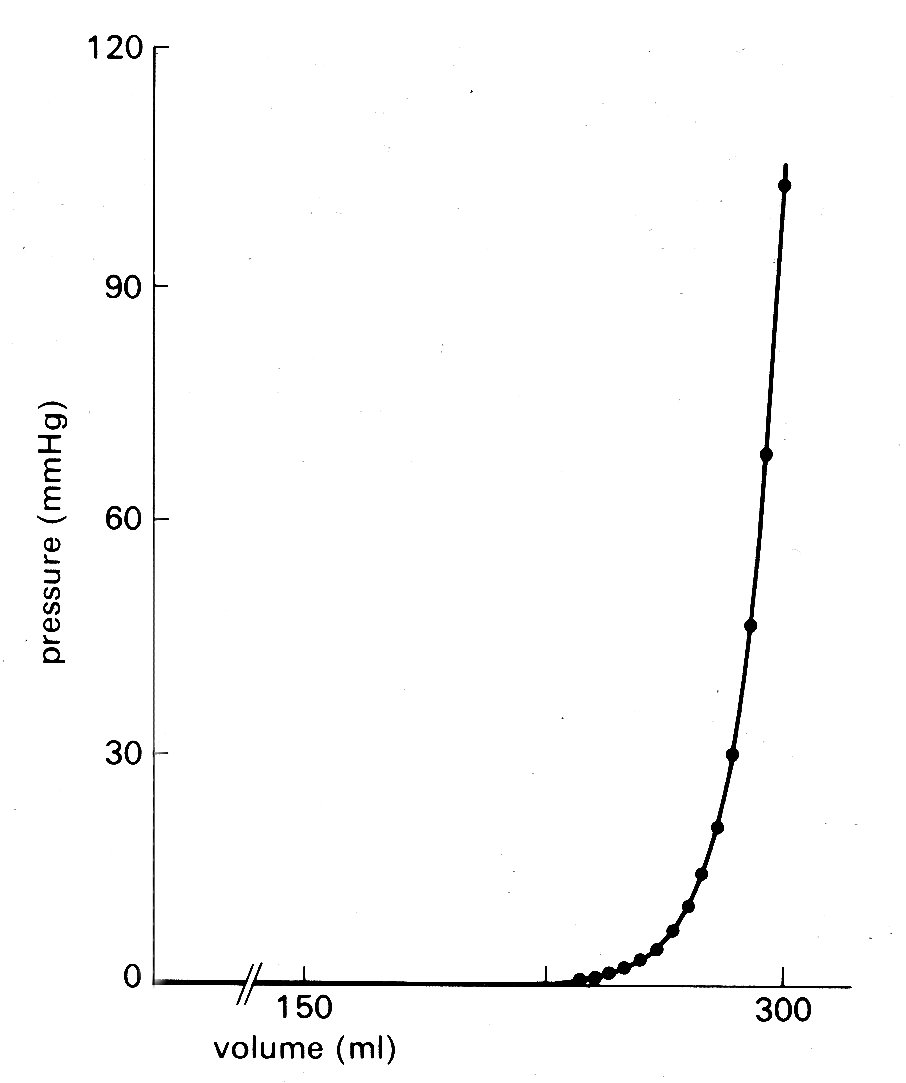
Fig. 11.3. Pressure-volume curve of pericardium of dog. (From Holt (1971). Circulation Res. 8, 1171. By permission of the American Heart Association, Inc.)
At normal diastolic heart volumes, the pericardium is only slightly stretched, and probably does not appreciably affect cardiac filling; in certain diseases where fluid accumulates within the pericardium, its constraint can restrict diastolic filling of the ventricles and severely reduce cardiac output (see p. 474).
The left ventricle is the only chamber whose wall-structure has been examined systematically. Recent studies of microscopic sections taken serially through the whole thickness of the wall have shown that older concepts of a ventricular wall made up of clearly defined muscle layers are incorrect, and that there is a well-ordered continuous distribution of fibre-orientation (Fig. 11.4).

Fig. 11.4. Muscle fibre orientation in wall of left ventricle, (a) The orientation of the long axis of the fibres at successive depths from the outer surface, (b) The way in which the angle made by the fibre with the circumferential plane of the LV changes continuously through the wall (after Streeter et al. (1969), Circulation Res. 24, 339).
The innermost (endocardial) fibres run predominantly longitudinally from the fibrous region around the valves (the base) to the other end of the roughly elliptical chamber (the apex); the fibres slightly further out into the wall lie at a slight angle to the axis of the chamber, so that the fibres spiral slightly as they run towards the apex. This angulation increases in successively deeper fibres so that those approximately half-way through the wall run parallel to the shorter axis of the chamber, i.e. circumferentially; thereafter the angulation continues, so that the fibres at the outside (epicardial) surface are once again longitudinal. This arrangement gives the ventricle great strength even though individual muscle fibres can only bear tension axially, since a stress applied to the wall in outer wall any direction can be resisted by at least a proportion of the muscle fibres, and there is no direction or plane of weakness. Note that fibres do not have to terminate at the apex; they can turn and spiral back towards the base like string wound spirally on a stick. As can be inferred from Fig. 11.4 (b), there is a great preponderance of fibres with a circumferential distribution.
Electrical events. The contraction cycle of the heart is initiated in a localized area of nervous tissue in the wall of the right atrium known as the pacemaker or sino-atrial node. This has the inherent property of cyclical depolarization and repolarization (the latter process being dependent upon metabolic energy, derived ultimately from metabolism within the cells). When depolarization occurs in the pacemaker, it spreads at about 1 m s-1 into and through the surrounding muscle of the right and left atrial walls (causing atrial contraction) and then into a discrete nervous pathway (the atrio-ventricular bundle, or bundle of His) which passes through the fibrous tissue around the tricuspid valve ring into the muscular septum between the two ventricles; here it divides, and spreads into the muscle mass of each ventricle, terminating in a series of fine fibres amongst the muscle-cells (Purkinje fibres). The wave of depolarization spreads through this system rapidly (5 m s-1), and therefore depolarization and contraction of all the muscle-fibres in both right and left ventricles are relatively synchronous; the ventricular depolarization potential on the electrocardiogram—the 'QRS' component—lasts less than 0.1 s. A number of nervous and hormonal influences which originate outside the heart may act on the pacemaker to cause alterations of frequency, and may modify the conduction velocity of the depolarization wave through the heart; but the orderly sequence of atrial and ventricular contraction which follows pacemaker depolarization is ensured largely by the layout of the conducting pathways.
The cycles of depolarization and repolarization which occur in cardiac muscle generate small electrical potentials, and with suitably located electrodes these Can be picked up at the surface of the body, and amplified and recorded as the electrocardiogram. A typical tracing is shown at the top of Fig. 11.5.
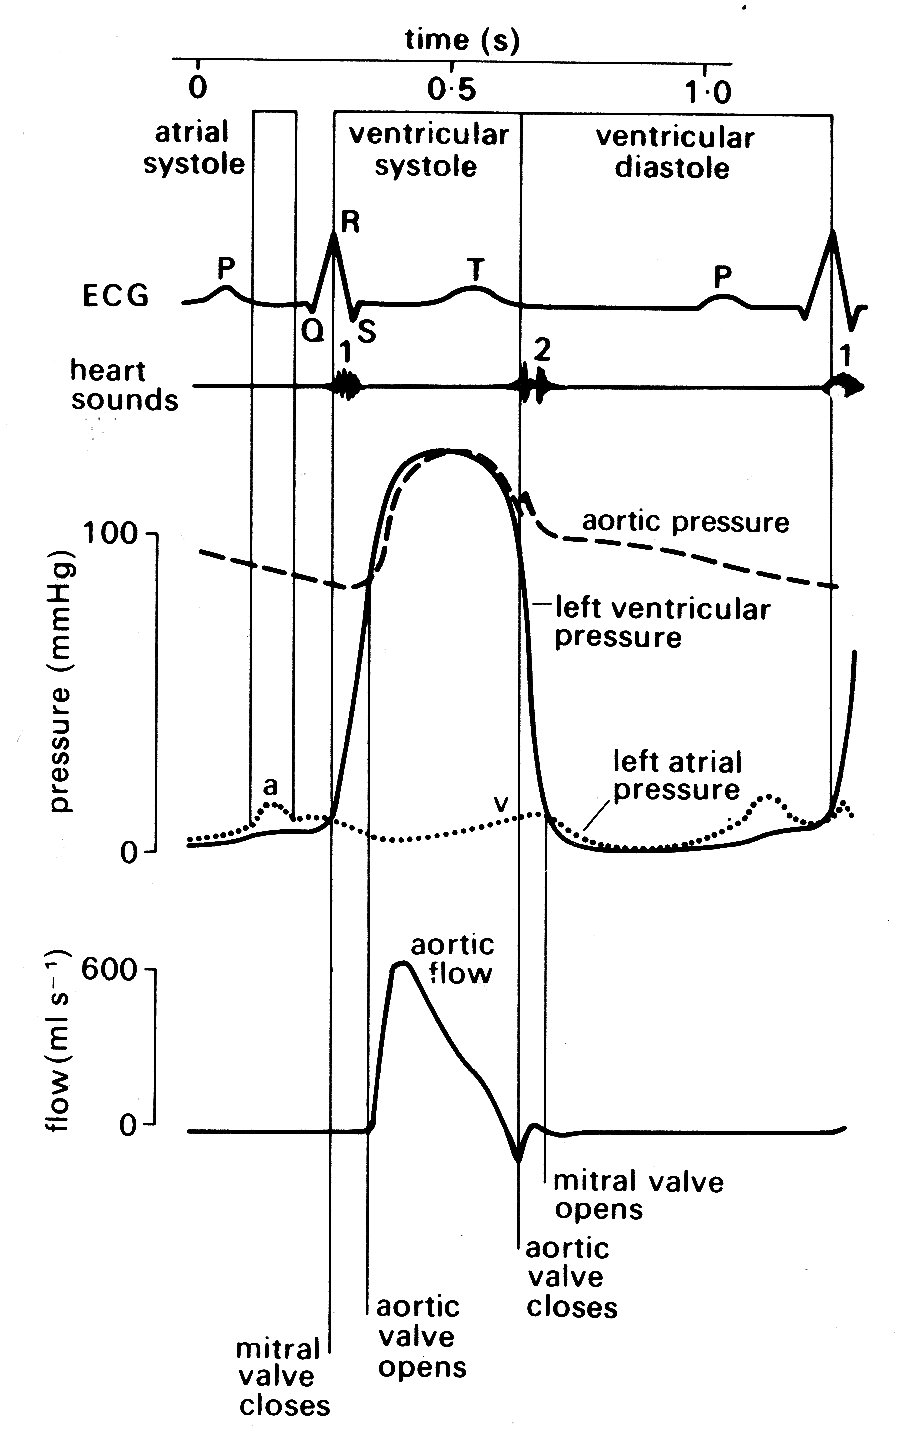
Fig. 11.5. Semi-diagrammatic illustration of the events on the left side of the heart during the cardiac cycle. All pressures related to atmospheric. The origin of the 'a' and 'v' wave in atrial pressure is discussed in the text, p. 189.
Depolarization of the atria produces a small deflection known as the T' wave; this is followed after a delay of about 0.2 s by a larger voltage deflection, often multiphasic, known as the 'QRS complex'. This reflects depolarization of the two ventricles, and is followed by a final component, the T' wave, which is generated during repolarization of the ventricles. The time relationships between these summed electrical potentials and the mechanical events on the left side of the heart can be deduced from Fig. 11.5, which shows the pressure and flow events that take place at a number of locations in the left side of the heart during a complete cardiac cycle.
Mechanical events. As has just been mentioned, the onset of ventricular contraction (ventricular muscle depolarization) is signalled electrically by the QRS complex of the electrocardiogram. Both ventricles contract almost synchronously (see Fig. 11.6),
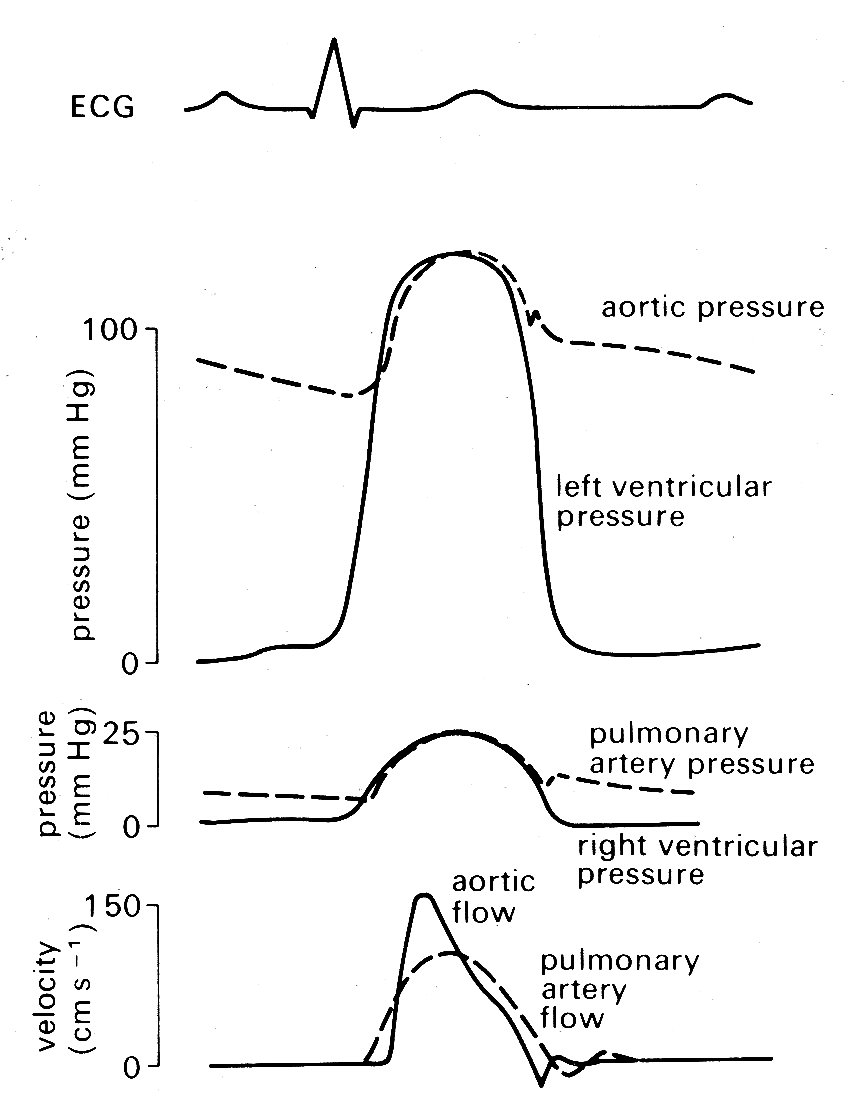
Fig. 11.6. Semi-diagrammatic illustration of pressure and flow occurring simultaneously on the left and right sides of the heart during the cardiac cycle.
but our description is simplified
if we consider events on the left side of the heart only. The sequence of events
is illustrated in Fig. 11.5. Depolarization is followed after a very short
interval by the onset of active tension development (see p.
193) in the muscle
fibres of the ventricular wall, and an increase in ventricular pressure. At this
stage, the aortic valve is still held closed because the pressure in the aorta
exceeds that in the left ventricle, and the cusps of the mitral valve are moving
together as flow into the ventricle dwindles. Almost immediately, ventricular
pressure rises above atrial pressure, and a brief period of backward flow from
ventricle to atrium occurs, terminated by closure of the mitral valve. This is
accompanied by a sound, audible at the chest wall and known clinically as the
first heart sound. This marks the onset of systole, the period of ventricular
contraction. The second heart sound marks the start of diastole, the period of
ventricular dilatation. Note that these periods are defined in relation to the
heart sounds and not in terms of muscle mechanics or the electrocardiogram.![]() In the ventricle, wall-tension now starts to rise extremely rapidly until the
pressure within the cavity exceeds that in the aorta. There is no change in
ventricular volume during this period, since blood is effectively
incompressible; it is therefore known as the isovolumetric period. (In the older
literature, it is often referred to as the isometric period; however, it is now
clear that the ventricle does change shape during this phase, even though volume
is constant, and the term isovolumic, or isovolumetric, is therefore
preferable.) When the pressure within the ventricle exceeds aortic pressure,
there is a net force operating to open the aortic valve, and the ejection phase
of systole commences. The blood in the ventricle and proximal aorta undergoes
rapid forward acceleration as left ventricular volume diminishes. Ventricular
wall-tension then falls, the pressure difference between ventricle and aorta is
reversed, and deceleration of aortic flow occurs. Finally, there is a brief
period of backflow before aortic valve closure takes place, accompanied by the
second heart sound. There then follows another isovolumetric period during which
the muscle relaxes and ventricular pressure falls. At the same time, pressure in
the left atrium is rising as it fills with blood from the pulmonary veins (the V
wave). When its pressure exceeds that in the left ventricle, the mitral valve
reopens. Ventricular filling then occurs, under the influence of a pressure
difference generated at first passively and then by active shortening of the
muscle fibres of the atrial wall; this active atrial contraction (atrial
systole) is heralded electrically by the 'P' wave of the electrocardiogram, and
marked mechanically by a brief increase in atrial pressure (the 'a' wave). Very
shortly after this, activation of the ventricular muscle occurs and the cycle
recommences.
In the ventricle, wall-tension now starts to rise extremely rapidly until the
pressure within the cavity exceeds that in the aorta. There is no change in
ventricular volume during this period, since blood is effectively
incompressible; it is therefore known as the isovolumetric period. (In the older
literature, it is often referred to as the isometric period; however, it is now
clear that the ventricle does change shape during this phase, even though volume
is constant, and the term isovolumic, or isovolumetric, is therefore
preferable.) When the pressure within the ventricle exceeds aortic pressure,
there is a net force operating to open the aortic valve, and the ejection phase
of systole commences. The blood in the ventricle and proximal aorta undergoes
rapid forward acceleration as left ventricular volume diminishes. Ventricular
wall-tension then falls, the pressure difference between ventricle and aorta is
reversed, and deceleration of aortic flow occurs. Finally, there is a brief
period of backflow before aortic valve closure takes place, accompanied by the
second heart sound. There then follows another isovolumetric period during which
the muscle relaxes and ventricular pressure falls. At the same time, pressure in
the left atrium is rising as it fills with blood from the pulmonary veins (the V
wave). When its pressure exceeds that in the left ventricle, the mitral valve
reopens. Ventricular filling then occurs, under the influence of a pressure
difference generated at first passively and then by active shortening of the
muscle fibres of the atrial wall; this active atrial contraction (atrial
systole) is heralded electrically by the 'P' wave of the electrocardiogram, and
marked mechanically by a brief increase in atrial pressure (the 'a' wave). Very
shortly after this, activation of the ventricular muscle occurs and the cycle
recommences.
In normal man, the heart-rate may range from about 45 min-1 (resting athlete) up to slightly above 200 min-1 on maximal exercise. Systole is much shorter than diastole at the lower heart-rates, occupying about a third of the cycle (Fig. 11.5); as the rate increases, there is a much greater shortening of diastole than of systole, until at the highest rates the two may be almost equal. The volume ejected from the ventricle with each beat (stroke volume) is normally in the range 70-100 cm3 at rest; a smaller volume remains in the ventricle - i.e. the ventricle ejects only 60-70 per cent of its contents. The variation in stroke volume with exercise is much less than that in the heart-rate; thus increases in cardiac output in severe exercise (five-fold or more) depend much more on rate increase than on stroke volume increase. Blood pressure rises in both the pulmonary artery and the aorta on exercise, but much more modestly than does the flow, because recruitment of additional vessels in the microcirculation, or dilatation of previously constricted ones, lowers the downstream resistance to flow.
Structure. Under the light microscope, the myocardium is seen to be made up of elongated muscle cells running in columns and having centrally placed nuclei and abundant mitochondria (Fig. 11.7).
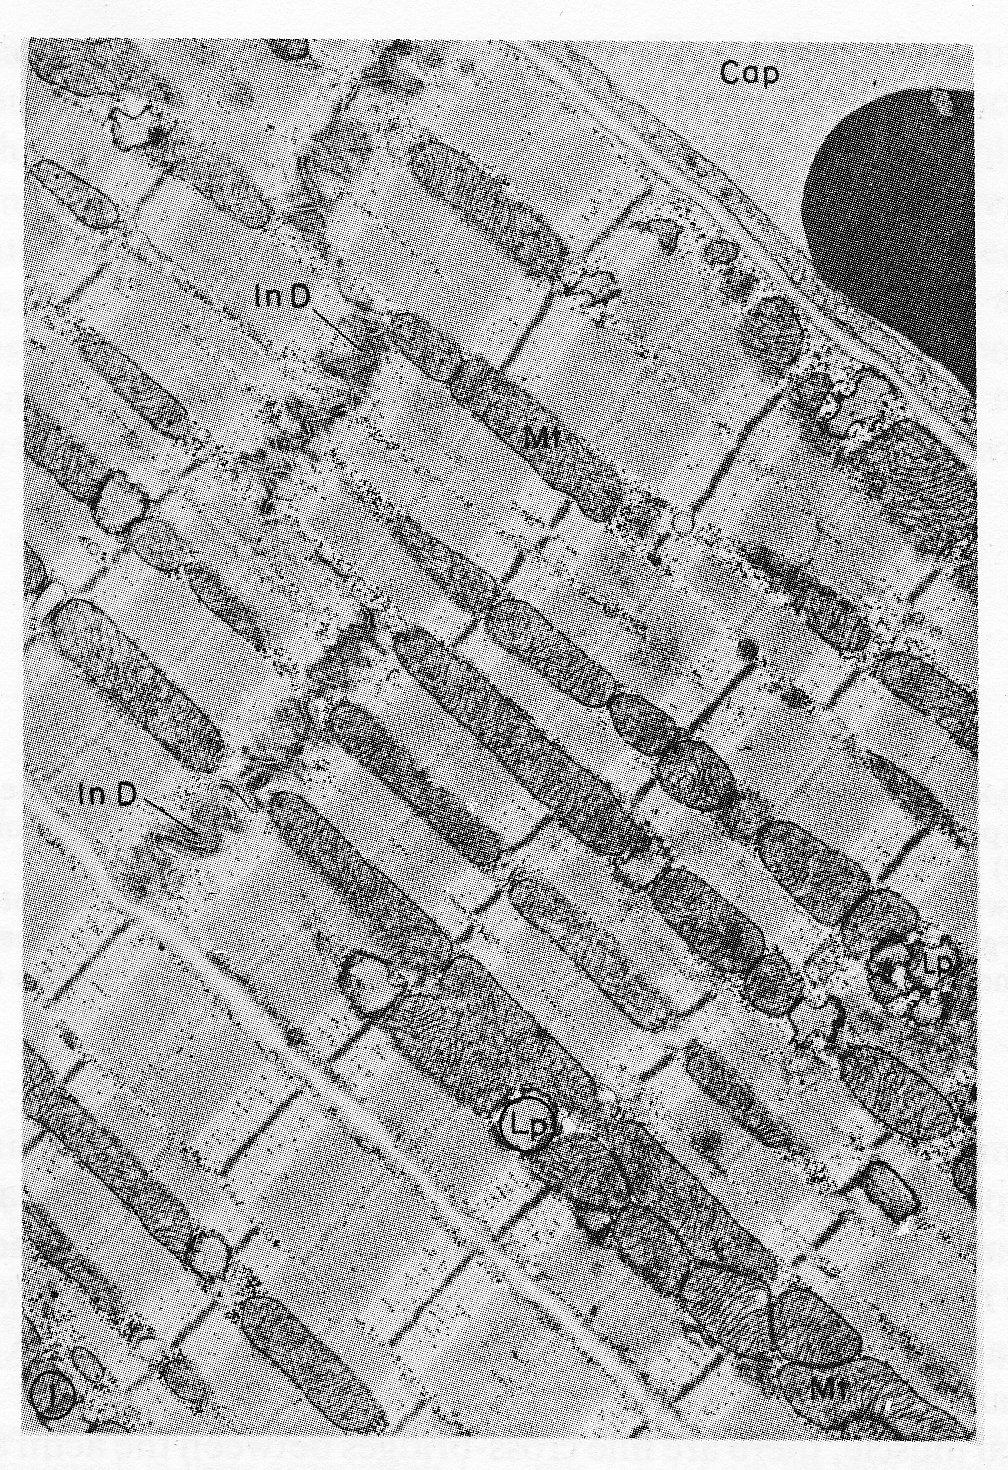
Fig. 11.7. Electron micrograph of parts of three cardiac muscle fibres and an adjacent capillary (Cap) in longitudinal section. The two upper cells are joined end to end by a typical steplike intercalated disc (In D). Rows of mitochondria (Mt) appear to divide the contractile substance into myofibril-like units but, unlike the true myofibrils of skeletal muscle, these branch and rejoin and are quite variable in width. Lipid droplets (Lp) somewhat distorted in specimen preparation are found between the ends of the mitochondria. xl5,000. The structure of a single sarcomere is shown at higher magnification in Fig. 11.8. (From Fawcett and McNutt (1969). 'The ultrastructure of the cat myocardium'. J. Cell Biol. 42, 1-45.)
As in skeletal muscle, the fibres have a cross-striated appearance which is due to the structure of the contractile units, or myoftbrils, lying within the cells. However, the motor nerve filaments, neuromuscular junctions, and the length-monitoring muscle-spindles present in skeletal muscle are absent from cardiac muscle; and further points of difference are that the muscle-cells branch repeatedly, and have abundant collagen fibres between them.
The limit of definition of the light microscope is about 0.25 mm, and at this level further detail is impossible to distinguish. Since there did not appear to be cell-membranes running across the fibres, it was assumed for some time that they had a syncytial structure, i.e. widespread continuity of cell cytoplasm. However, electron microscopy has revealed that the cell-membrane has two layers, with the inner layer passing across the fibres and dividing them every 50-100 mm into structurally separate cells, about 10-20 mm in diameter. At intervals of about 2 mm all along each such cell there are extremely fine invaginations of the cell-membrane known as T-tubules, which have been shown to provide for almost simultaneous activation of all the myofibrils in the cell when the membrane is depolarized.
Numerous other fine details of cell structure have been described, and a great deal of recent progress has been made in clarifying the biochemical reactions which release energy for contraction and repolarization. However, we will concentrate only on the contractile apparatus, since our interest lies in the mechanics of the muscle-fibres.
As mentioned previously, the contractile elements of each cell are the myofibrils, which run parallel to the long axis and show a repeating pattern of cross-striation. The myofibrils themselves actually consist of bundles of myofilaments, and the cross-striations repeat themselves because the myofilaments are made up of repeating chains of sarcomeres. The sarcomere is the fundamental contractile apparatus; its structure was first described in skeletal muscle, and has been confirmed in cardiac muscle with only minor differences. Each sarcomere is limited by two adjacent narrow bands known as Z bands or lines (Fig. 11.7); in between it is subdivided into a wide central A band, separated from each'Z band by a narrow, lighter I band. When the muscle-fibre is stretched, the distance between the Z bands widens; but the A bands remain the same length. All this can be distinguished under the light microscope; sarcomere-length increases with increase of overall muscle-length, and in heart muscle at its diastolic length is about 2.2 mm; the A band is 1.5 mm and the I bands 0.35 mm each.
A series of elegant electron microscopy studies has shown these bands to be due to partially overlapping parallel arrays of filaments, arranged as in Fig. 11.8.
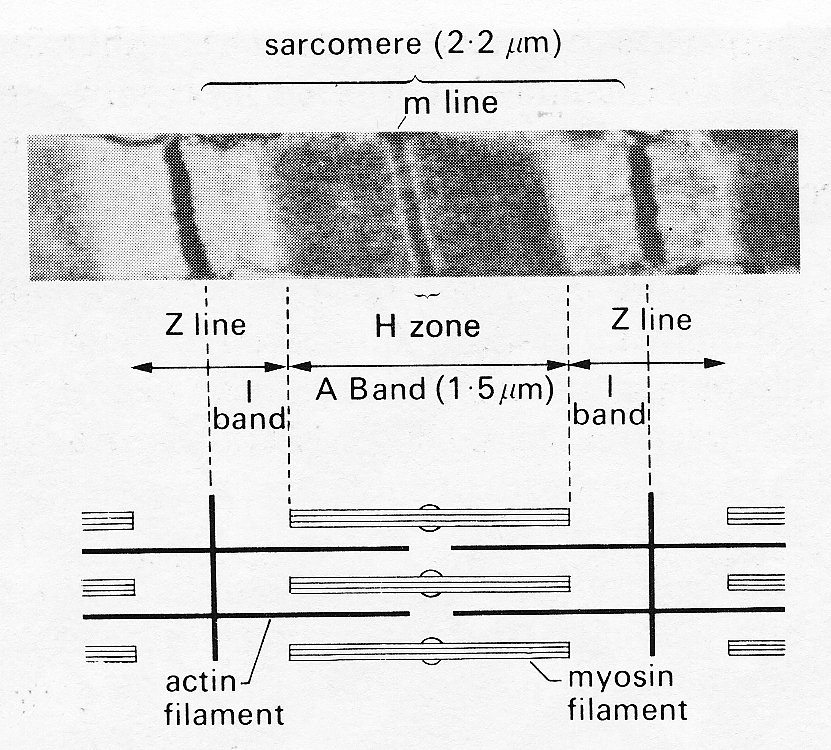
Fig. 11.8. Above: sarcomere
structure as seen with the electron microscope. The sarcomere is bounded by a
pair of Z bands. Within it is the dark central A band (marked at its midpoint by
the darker m line) and two paler I bands.
Below: shows in schematic form the disposition of the rods
of the contractile proteins actin and myosin which give rise to this appearance.
Note that at this length the actin filaments do not reach past the midline of
the sarcomere, so that no 'contraction band' is visible. See text for details.
(From Sonnenblick, Spiro, and Spotnitz (1964). Am. Heart J. 68,
336.)
The thicker filaments making up the A bands are composed primarily of the protein myosin; the thinner rods which interdigitate with them are actin. When the muscle is stretched, the Z bands move apart and the actin rods slide along and partially disengage from the myosin rods; thus the I bands widen. When the muscle contracts, the reverse happens, until at very short muscle-lengths the I bands disappear, and new dark bands ('contraction bands') appear where the actin rod tips overlap each other at the centre of the A band. This occurs at sarcomere lengths less than 1.5 mm.
In skeletal muscle, there are fine cross-bridges between the actin and myosin filaments, projecting from each thick (myosin) filament. There is probably one cross-bridge per molecule, and they are spaced about 6 nm apart, arranged helically at 60° intervals round the myosin filament. Each myosin filament is surrounded by six actin filaments, and therefore makes one cross-bridge with each of these in a length of approximately 40 nm.
The cross-bridges seem likely to have an important role in the shortening process of striated muscle, since the filaments themselves are probably too far apart for direct interaction; one suggestion is that during contraction the cross-bridges may move back and forth, hooking up to specific sites on the actin filaments and drawing them on before releasing the linkage and moving back to a new linkage site. Thus during activity they would have a ratchet action; with the cessation of activity the filaments would be free to slide apart passively. To date, this remains a speculative explanation, particularly when applied to cardiac muscle.
Static mechanical properties of cardiac muscle. The 'sliding filament' description of sarcomere behaviour outlined above is doubly compelling because it not only fits with the visible ultra-structure of muscle, but offers an explanation of one of its fundamental mechanical properties - the length-tension relationship. When a muscle is held at a constant length and stimulated electrically it generates tension (active or developed tension) over and above any resting tension present prior to stimulation. If this experiment is repeated with successive small increments in length, the active tension is found to increase successively to a peak and then decline (Fig. 11.9).
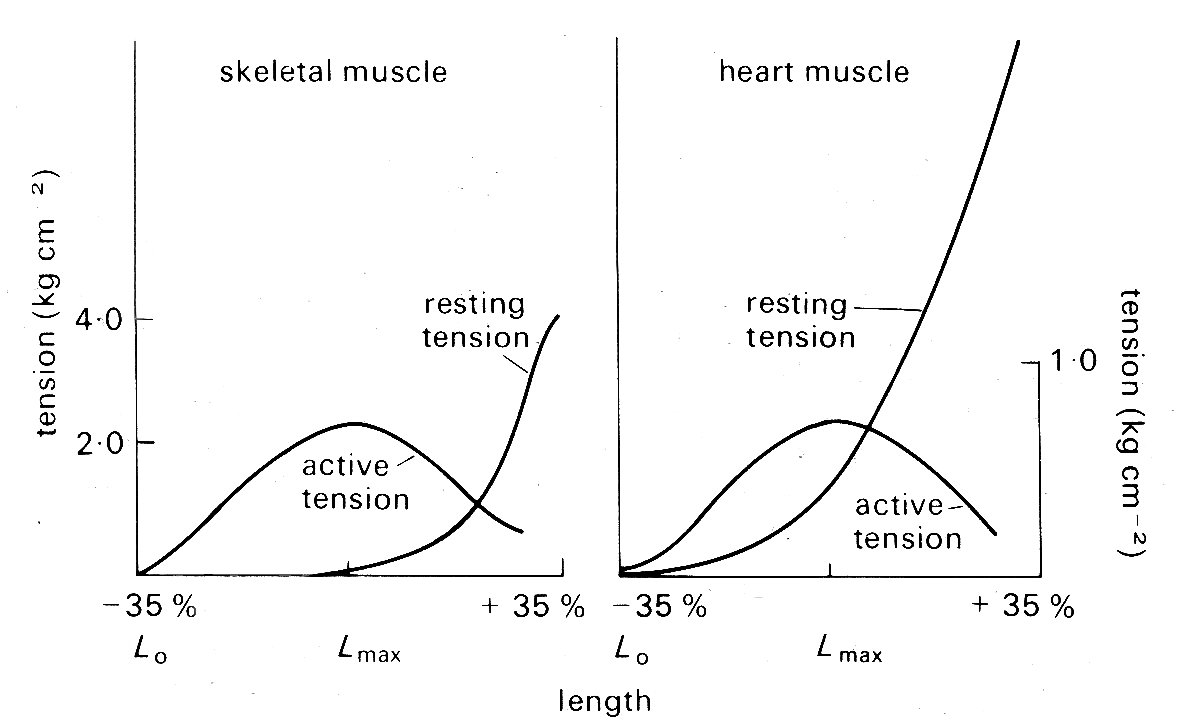
Fig. 11.9. Typical length-tension curves for skeletal and cardiac muscle. In each case resting and active tension was plotted against length as the muscle was held at a series of lengths and stimulated electrically to contract. The ordinates show tension, expressed in kilograms per square centimetre of muscle cross-sectional area. Note the difference in scaling of the two graphs. The abscissae show sarcomere lengths, relative to the lengths Lmax, at which the maximum active tension was developed; in these experiments Lmax was 2.2-2.3 mm for both skeletal and cardiac muscle. (After Spiro and Sonnenblick (1964). 'Comparison of the ultrastructural basis of the contractile process in heart and skeletal muscle'. Circulation Res. 15, supplement 2, pp. 14-37. By permission of the American Heart Association, Inc.)
This is true for a wide variety of muscle, and in skeletal muscle (and probably also cardiac muscle) the peak of the length-tension relation comes when the degree of stretch brings sarcomere length to about 2.2 mm. Fig. 11.9 suggests that in absolute terms (i.e. per unit cross-sectional area) heart muscle is much weaker than skeletal muscle. This may be more apparent than real, since heart muscle contains a greater bulk of non-contractile tissue such as collagen and mitochondria, and the muscle fibres are not all parallel. In muscle which has contracted at sarcomere lengths of less than 2.2 mm, the actin rods reach right in past the midpoint of the myosin rods and overlap their opposite numbers; it is postulated that this interferes with the formation of cross-linkages so that less than maximum tension can be developed. This overlap lessens as the muscle is stretched, until at a sarcomere length of 2.2 mm the actin and myosin rods cease to have a double overlap, and the maximum number of cross-linkages can be formed. It is at this length that the maximum active tension can be developed. As the sarcomere is stretched beyond this, the actin rods are progressively withdrawn from between the myosin rods, and fewer cross-linkages can form. In this length range, the active tension developed in a contraction declines linearly with length increase, until at a sarcomere length of about 3.5 mm the actin rods are fully withdrawn and the muscle ceases to generate any active tension.
In skeletal muscle this relationship between sarcomere length and tension has been firmly established, and its functional significance is generally agreed. The behaviour of sarcomeres in cardiac muscle has been investigated much less thoroughly; under physiological conditions they appear to operate in the length range from about l.5 mm to 2.2 mm - sarcomeres measure approximately 2.2 mm when ventricular diastolic pressure is about 12 mm Hg, which is the upper limit of normal, and thus the sliding filament hypothesis is an attractive explanation of myocardial length-tension relations. However, relatively few observations have been made on the relationship between sarcomere length and developed tension in cardiac muscle, and these are to some extent conflicting. This may be because of technical problems, particularly those of tissue distortion during histo logical preparation; methods have recently been developed to measure sarcomere length in vivo, and these may resolve the question. At present, it seems well established that no active tension is developed at sarcomere lengths less than about 1.5 mm and that the peak of the length-tension curve normally occurs somewhere between 2.0 mm and 2.2 mm, as it does in skeletal muscle. In between it is not clear whether increasing tension is the result of successive increments in sarcomere length as in skeletal muscle, or recruitment of increasing numbers of sarcomeres in muscle-fibres which were buckled at short muscle-lengths and are straightened and then stretched as the muscle lengthens. Furthermore, there is recent evidence that the curve relating tension and sarcomere length (Fig. 11.9) may be displaced along the sarcomere length axis in response to changes in the chemical environment of the muscle. We need a more detailed knowledge of the behaviour of actin-myosin cross-linkages to settle these uncertainties.
In skeletal muscle, the linear relationship between muscle-length and sarcomere length is maintained until the latter reaches at least 3.5 mn, and the progressive reduction in available cross-linkage sites as the actin and myosin filaments are gradually pulled apart offers an adequate explanation of the linear decline of active tension along the 'descending limb' of the length-tension curve. For heart muscle, the situation at high degrees of stretch is different. Sarcomeres will lengthen to only about 2.6 mm and even in this range the linear relationship described above does not hold; increments in overall muscle-length beyond this point require the imposition of very high resting tensions and probably involve sliding of whole fibres relative to each other. This situation does not arise in the normal heart and seems very unlikely even in the failing or pathological heart; in acute experiments where the relaxed left ventricle was distended with pressures as high as 100 mm Hg (far in excess of the levels reached even in severe heart disease) the sarcomeres in the ventricular wall had an average length of only 2.3 mm.
Dynamic mechanical properties of cardiac muscle. The length-tension curve describes an important property of muscle under static conditions - held at a constant length both before and during activity - but it throws no light on the dynamics of muscular contraction, which are of fundamental importance to any understanding of heart muscle performance.
A stimulated muscle goes through a period of mechanical activity (the 'active state') which reflects the release of energy derived from chemical reactions and has measurable properties both of duration and intensity. Enormous progress has been made in elucidating and measuring both the biochemical steps which yield energy, and the mechanical behaviour which is the expression of this energy release. The literature is voluminous, reflecting both the technical difficulties involved in research on the myocardium and its innate complexity, and the subject can only be briefly surveyed here.
The commonest material used for experimental study of the mechanical properties of heart muscle has been papillary muscle, removed from the right ventricles of young animals under anaesthesia. It can be obtained in this way as extremely thin strips a few millimetres in length, and made up of numbers of fairly parallel muscle fibres. When such papillary muscles are mounted in oxygenated, nutrient media of appropriate ionic and osmotic properties, they preserve their contractile properties in response to electrical stimulation for long periods. These contractile properties have been interpreted largely in terms of very simple mechanical models; to demonstrate why such models were chosen it is necessary briefly to describe some early experimental work carried out on skeletal muscle.
Intact skeletal muscles can be removed easily from small animals such as the frog, and a number of workers in the early years of the twentieth century studied these muscles, stimulating them electrically and examining the mechanical properties and heat production during contraction (the latter phenomenon having been demonstrated by Helmholtz over fifty years previously).
As was mentioned earlier, electrical stimulation of muscle leads to tension development. In the resting state, a potential difference of about 90 mV is maintained across the membrane of the muscle-cell - the resting potential. An externally applied shock can cause transient reversal of polarity of this potential, followed by slow recovery. This discharge, which is known as the action potential, triggers the release of calcium ions from stores within the muscle-cell, and these somehow activate the cross-linkages between the actin and myosin rods in the contractile apparatus of the sarcomeres. This whole process occurs within milliseconds, and the muscle cell is then capable of contracting (i.e. shortening and/or generating tension) for a short time before metabolic processes within the cell remove the calcium ions and the muscle returns to the resting state.
Thus a single electrical stimulus applied to a muscle-fibre causes a short-lived contraction appropriately known as a twitch. A chain of stimuli causes repetitive twitches, and in skeletal muscle if the stimulation frequency is high enough the twitches will fuse together to give a sustained contraction. This is known as a tetanus, and the corresponding train of shocks is a tetanic stimulus.
For a given muscle preparation, the tension generated in each twitch or tetanus will increase with increasing stimulus strength until a maximum is reached which is highly reproducible over long periods of time. If the muscle is held at constant length, the twitch or tetanus is known as isometric; if it is allowed to shorten, the force (if any) opposing shortening is described as the load (or afterload) and if this force is constant, which implies that all accelerations of the load are very small compared to that due to gravity, the contraction is called isotonic. Since maximal isometric contractions were found to be highly reproducible, they were used experimentally as the baseline condition; in this case the muscle generated heat during the course of a stimulation cycle, but since no shortening occurred, no external work was done (work, or energy, is equivalent to force times distance). When muscles were allowed to shorten by a distance x against a load or force P, not only were Px units of work done, but an extra amount of heat was released. (This effect of shortening on heat production is known as the 'Fenn effect' after its discoverer; Fenn (an American physiologist who did this work in 1923) also demonstrated the converse to be true - if a muscle was stretched during stimulation, it gave out less heat than when held at constant length. In describing this experiment, Fenn coined a phrase, 'negative work', which has given pain to physical scientists ever since; this is unfortunate, since the implication of the experiment - that the mechanical conditions during contraction control the amount of energy released - is fascinating and appears to have been little explored.)
The explanation of this liberation of excess heat on shortening came some years later when instruments capable of following heat-production instant by instant through the contraction and relaxation cycle became available. It was then shown in a famous series of experiments carried out by A. V. Hill that the extra heat associated with shortening is proportional to the distance x shortened; thus it is equivalent to ax units of work where the constant a has the dimensions of force. Now the amount of mechanical work done is Px units; so the total extra energy released in shortening is (P + a )x, and the rate of release of energy is (P + a) v, where v (= dx/dt) is the velocity of shortening. This rate of energy liberation was found experimentally to increase as load diminished, having its highest value when the load was zero and being zero when the muscle exerted its maximum force in an isometric contraction. The relationships were found experimentally to fit best in the form
(P + a) v = b (P0 - P), (11.1)
where b is a constant with the dimensions of velocity. This can be rewritten
(P + a)(v + b) = b (P0 + a), (11.2)
where the right-hand side is a constant and a hyperbolic relationship is predicted between the force P and velocity v of contraction. Thus the properties predicted from thermal measurements were open to confirmation by purely mechanical experiments, and were indeed verified when the velocity with which a muscle could shorten isotonically against various loads was examined (Fig. 11.10).
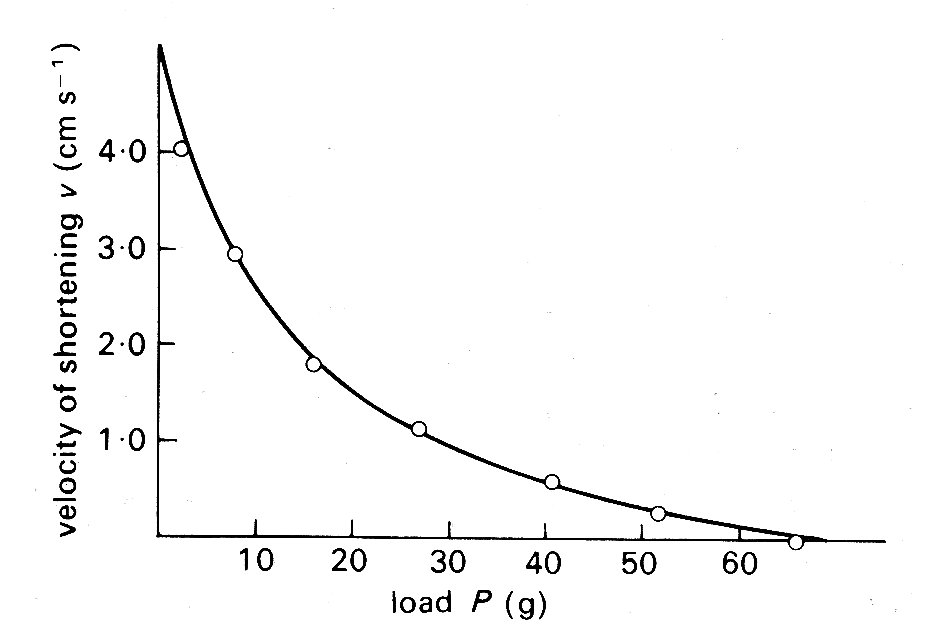
Fig. 11.10. Relationship between load P (grams-weight) and velocity of shortening v (cm s-1) in isotonic shortening of frog skeletal muscle. The points were obtained experimentally; the line was derived from Equation (11.2) in the text. (From Hill (1938). Proc. R. Soc. B 126, 136.)
The thermal observations were, however, of great importance in another way, since they suggested the first conceptual mechanical model of the muscle fibre. Observations on the course of heat release in the very early stages of stimulation revealed that it was similar for both isometric and isotonic contractions. This suggested that similar mechanical events were occurring in the early stages of both types of contraction, and since the length of the muscle fibre could not change in an isometric contraction, the idea arose of a contractile element in the muscle, which shortened on stimulation but which was linked in series to an elastic element that could lengthen if muscle length was held constant (Fig. 11.11 (a)).
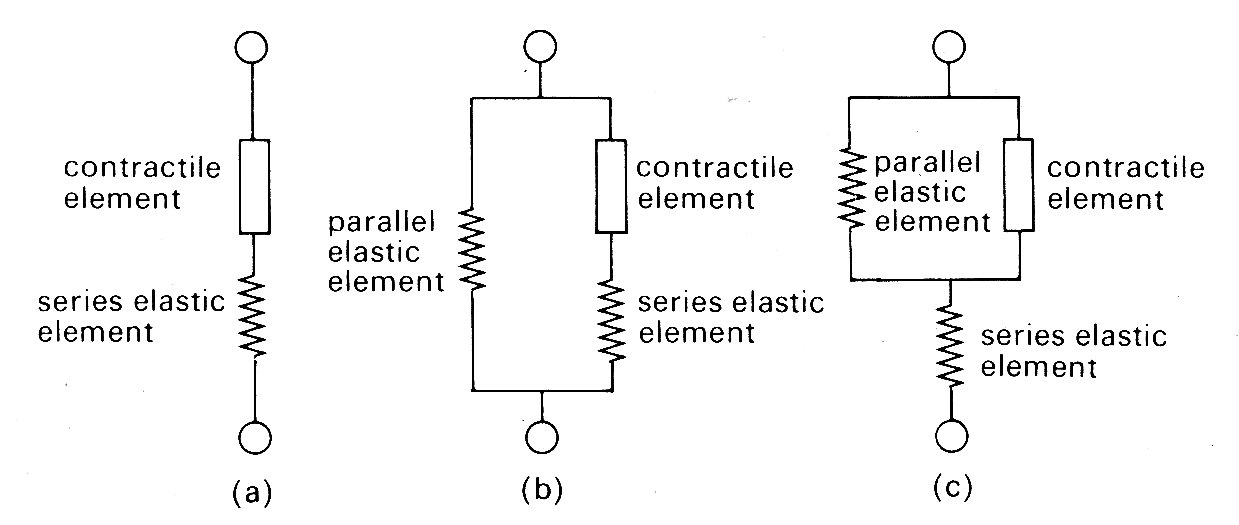
Fig. 11.11. Mechanical models of muscle.
The force-velocity relationship described above was assumed to describe the properties of the contractile element, since in steady shortening under isotonic conditions the elastic element would have constant length and would not contribute.
It should be stressed that Hill was examining the properties of skeletal muscle under very particular conditions. First, the muscle was stimulated with trains of high frequency shocks (tetani), so that a prolonged and maximal response occurred. Thus each observation was carried out with a constant load and a steady velocity of shortening. The real physical properties of the series elastic element were not considered, since it was at constant length throughout. Similarly, the time-course of development (or decay) of force was ignored. Furthermore, resting tension was very small at the muscle-lengths used (approximately 2 per cent of active tension), and therefore a model with two elements was adequate. The addition of a component to account for tension in the resting state (parallel elastic component, as in Fig. 11.11 (b) and (c)) which becomes necessary to allow for resting tension at longer muscle lengths (Fig. 11.9) was not considered in any detail; it was represented as a simple elastic element with no part to play in active shortening, and its nature and mode of coupling to the other two were deliberately left vague. Finally, the exact nature and location of the contractile element and the series elastic element also remained undefined; structures such as tendons might represent a genuine elastic element, or the internal contractile mechanisms might be elastic. Nonetheless, this 'two-element' model of active skeletal muscle achieved widespread acceptance, since it explained a range of mechanical and thermal observations. It was natural, in view of the structural similarity which exists between sarcomeres in cardiac and skeletal muscle, to consider its applicability also to cardiac muscle.
Problems arose immediately. First, cardiac muscle preparations exhibit appreciable tension throughout the range of lengths from which they will contract; thus the parallel elastic element becomes an essential part of the model, and the force-velocity relation can be examined only incompletely, since forces at and near zero cannot be achieved. Second, and far more important, is the fact that under normal conditions it is not possible to tetanize cardiac muscle like skeletal muscle and get a sustained and highly reproducible isometric contraction. Cardiac muscle repolarizes relatively slowly, and repeated stimuli do not produce a steady, maintained contraction. Instead, they produce twitches which even at high stimulation frequency only partially merge, giving a 'saw tooth' time-course of tension or shortening. Thus an incomplete cycle of relaxation and contraction occurs with each stimulus. At lower frequencies, stimuli evoke twitches which are clearly separated and may be highly reproducible, but neither of these types of response represents a steady state of activity, since the tension-generating and shortening capacity of the muscle (its active state) may be changing continuously during a contraction. A series of twitch responses from a papillary muscle preparation is shown in Fig. 11.12.
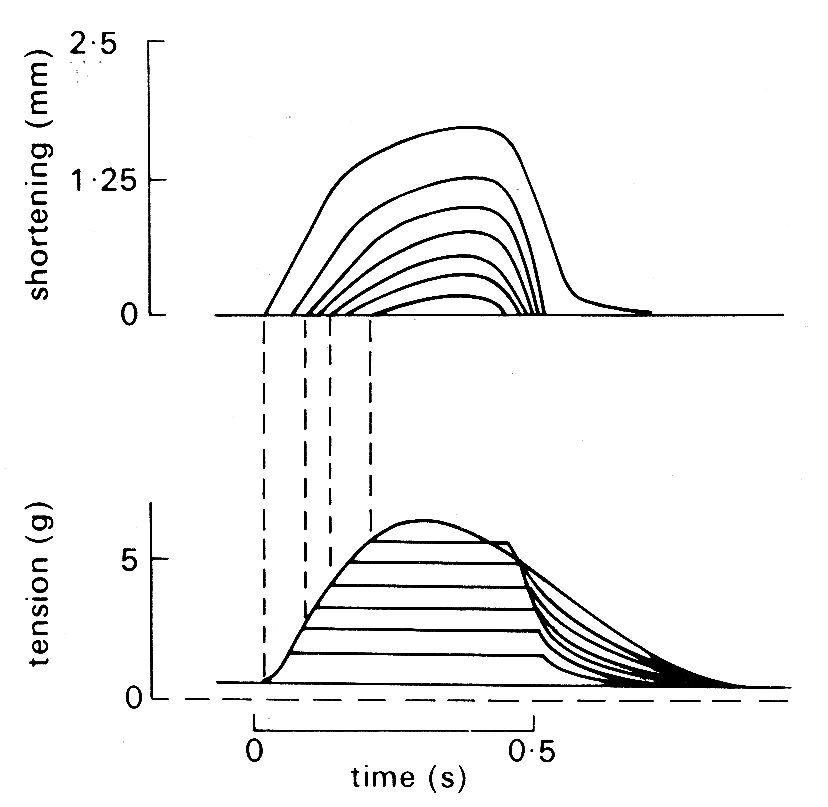
Fig. 11.12. A series of superimposed records showing the length and tension changes that occur in a cat papillary muscle which contracts against a series of different loads. The initial length was held constant; the lower family of curves shows that tension rose to match the load in each case, and then remained constant whilst shortening occurred. The amount of shortening at each load is shown in the upper curve. The final tension curve shows the response when the muscle cannot lift the load; this is the isometric twitch response. (From Sonnenblick (1962). Am. J. Physiol. 202, 931.)
This greatly complicates the design and interpretation of experiments. The intensity of the active state (however it may be assessed) is obviously an important property of the muscle; but it becomes extremely elusive if it is changing throughout a contraction. The problems are best illustrated by examples. Hill originally defined active state as the tension which the contractile element could bear without changing length; thus it could only be measured when the contractile element velocity was zero. Even in skeletal muscle this was only easy when tension had reached a sustained maximum value in an isometric tetanus; in this situation the contractile element has moved right along the force-velocity curve (Fig. 11.10), shortening progressively more slowly against the growing tension in the stretched series elastic element until it comes to rest; the intensity of the active state is then given by the value of P0 (Equation (11.1)). If on the other hand the contraction is not steady, but takes the form of an isometric twitch in which the active state rises and then falls, it is obviously extremely unlikely that the contractile element would be brought to rest by the load just at the time when activity was maximal. But unless this happens, the maximum recorded tension will not correspond to Po, and the intensity of the active state will be underestimated. The measurement is feasible if some means is devised to hold contractile element length constant, for example by controlled stretching of the muscle during the contraction; but the experimental difficulties are very great.
An alternative approach (which to some extent added confusion, since it introduced another definition of active state) has been to use the unloaded velocity of shortening as an index of active state. This is easier to examine experimentally; the muscle is released from its load at different points during successive twitch cycles and the velocity of shortening is measured immediately after the muscle has sprung back to unloaded length. An example of the results obtained in such an experiment is shown in Fig. 11.13;
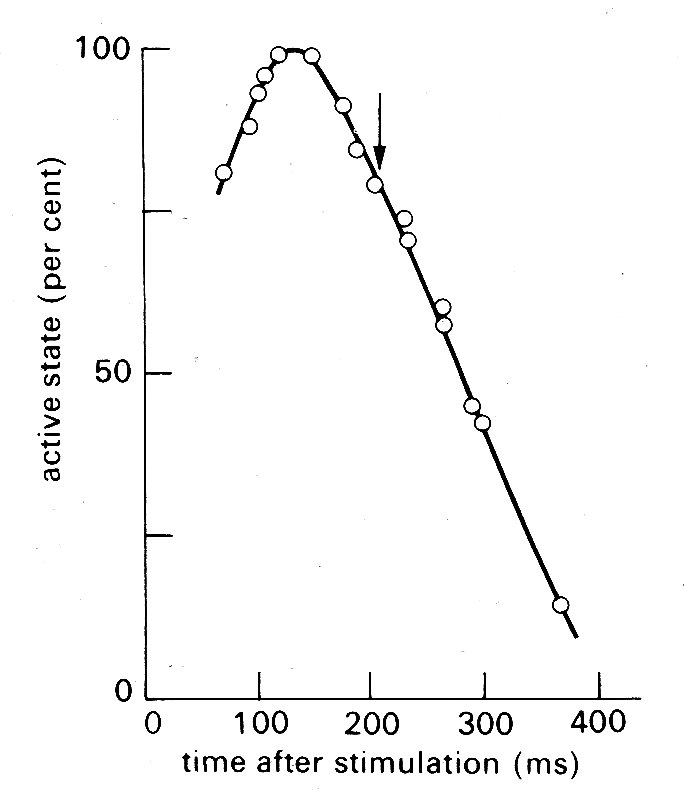
Fig. 11.13. Time-course of active state in cardiac muscle as measured by released isotonic contractions. The arrow shows the time at which peak tension was achieved in an isometric twitch. (From Edman and Nilsson (1968). Acta Physiol. Scand. 72, 205.)
the active state rises to a peak about 150 ms after stimulation (a little before peak tension is reached in an isometric twitch) and then declines steadily.
Recently, however, the techniques based on contractile element velocity have been shown to have a flaw because the duration of active state has been found to depend on length changes in the contractile element; if it shortens at any point in the contraction, the active state wanes earlier. In recent experiments, therefore, the subject has been re-examined by a more sophisticated approach; the stress-strain characteristics of the series elastic element in a muscle are measured first, and then computer-controlled mechanical feedback is used to pull on the muscle during contraction so that it is continuously lengthened by just the amount necessary to keep the contractile element length constant; the tension on the muscle at each instant through the contraction cycle then defines the active state. This method gives a time-course and intensity of active state which differ only a little from the isometric twitch response, the chief difference being a fractionally earlier rise and fall in active state. Even this, however, is unlikely to be the last word, because it has been demonstrated still more recently that the series elastic element has time-dependent properties, and the amount of stretch needed at different times in the cycle to fix contractile element length will therefore not depend solely on instantaneous tension.
These studies, culminating with the paradox that the contractility of a
papillary muscle preparation is best defined by an experiment in which it is
forced to lengthen, are described in some detail because they highlight the
difficulties which arise in the experimental study of cardiac muscle mechanics
at this level. It should by now be apparent that at least four variables - time,
length, tension, and velocity - are important; and a whole range of extraneous
factors which affect contractility such as temperature, oxygenation, and ionic
environment need stringent control. Blinks and Jewell ![]() have provided a useful
recent survey of the subject; they point out that since the standard experiment
explores the relationship between a pair of variables, six classes of experiment
are needed to explore the inter-relationships between time, length, tension, and
velocity. We do not explore this subject in detail, but certain general conclusions are
important enough to need stating. The inverse relationship shown to hold for
skeletal muscle between developed force and velocity of shortening (Fig.
11.10)
applies also to cardiac muscle (though it is not usually precisely hyperbolic).
This must be immediately qualified by pointing out that the force-velocity
relationship is influenced by muscle-length and by the active state of the
muscle. The effect of length can be predicted qualitatively from the
length-tension relationship shown in Fig. 11.9; as the initial length increases,
the force-velocity curve is shifted upwards on its axes. Thus in order to
present the properties of the muscle graphically, we would need a
three-dimensional plot, with two of the axes being contractile element force and
velocity (as in Fig. 11.10) and the third being muscle-length. Then at any level
of active state in the muscle, the various possible combinations of these would
form a three-dimensional surface within the axes.
have provided a useful
recent survey of the subject; they point out that since the standard experiment
explores the relationship between a pair of variables, six classes of experiment
are needed to explore the inter-relationships between time, length, tension, and
velocity. We do not explore this subject in detail, but certain general conclusions are
important enough to need stating. The inverse relationship shown to hold for
skeletal muscle between developed force and velocity of shortening (Fig.
11.10)
applies also to cardiac muscle (though it is not usually precisely hyperbolic).
This must be immediately qualified by pointing out that the force-velocity
relationship is influenced by muscle-length and by the active state of the
muscle. The effect of length can be predicted qualitatively from the
length-tension relationship shown in Fig. 11.9; as the initial length increases,
the force-velocity curve is shifted upwards on its axes. Thus in order to
present the properties of the muscle graphically, we would need a
three-dimensional plot, with two of the axes being contractile element force and
velocity (as in Fig. 11.10) and the third being muscle-length. Then at any level
of active state in the muscle, the various possible combinations of these would
form a three-dimensional surface within the axes.
In practice, it is difficult to draw such graphs realistically, because they need to show both positive and negative velocities (i.e. shortening and lengthening), and the rising and falling limbs of the length-tension relationship, if they are to describe the whole contraction. In trying to understand how the properties of the muscle interact, it is easier just to consider two types of contraction - isometric and isotonic.
The simpler example is an isometric twitch, since it avoids muscle-length changes. The contraction starts at some point on the resting length-tension curve (Fig. 11.9). Initially, the contractile element begins to shorten very fast, since it is relatively lightly loaded; thus velocity rapidly increases. However, since shortening of the contractile element implies lengthening of the series elastic element, force builds up and the contractile element velocity is then reduced progressively until it becomes zero; at this point the maximum force (equal to the sum of active plus resting tension in Fig. 11.9) is being developed, and the muscle has moved along the force-velocity curve in Fig. 11.10 to intercept the load (force) axis. Thereafter, relaxation occurs, and the muscle returns to the original starting point on the resting length-force line.
If the muscle shortens against a load during contraction (isotonic contraction) the situation is slightly more complicated. At first the contractile element shortens and develops force, stretching the series element as for the isometric case. Then a point is reached where the force equals the load; thereafter, force remains constant, and the whole muscle begins to shorten with the series elastic element at constant length. The demand for constant force at diminishing muscle-length can only be met by a diminishing contractile element velocity (Fig. 11.14);
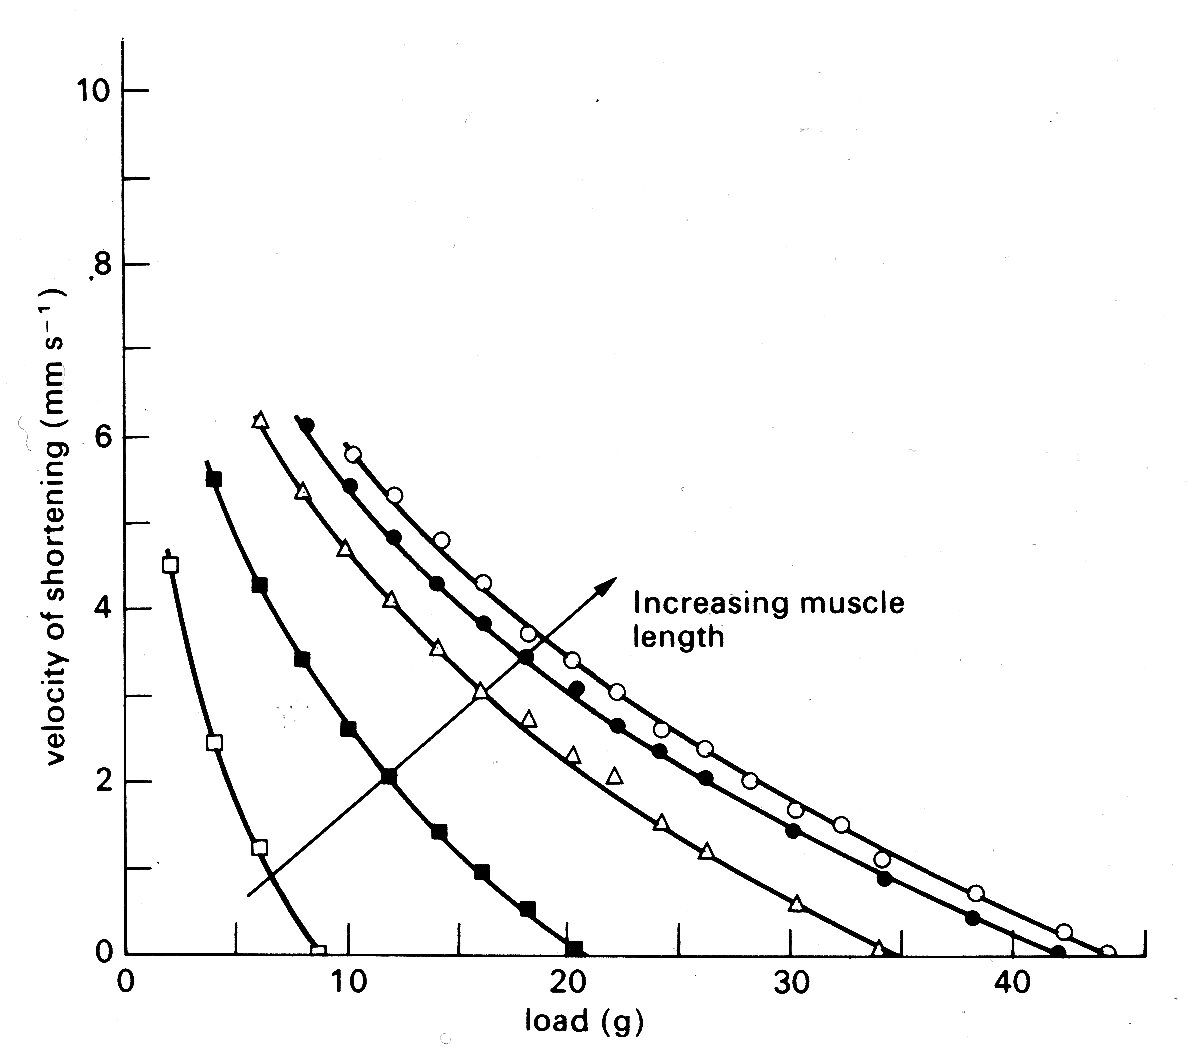
Fig. 11.14. Curves illustrating the length dependence of the force-velocity relationship in cardiac muscle. Each curve is plotted from a series of contractions against different loads such as those shown in Fig. 11.12. Successive increases in the initial length of the muscle displaced the curves farther and farther to the right. (After Sonnenblick (1962). Am. J. Physiol. 202, 931.)
so the muscle shortens more and more slowly, until it begins to relax, and again returns to the starting point on the resting length-tension curve.
In the real heart, both isometric and isotonic phases occur during contraction, and, as will be seen later, the load (i.e. force) is changing continuously during the isotonic phase; it is easy to imagine that the detailed behaviour during such a contraction would be extremely complicated. Furthermore, we have ignored a major factor which complicates all these relationships - the importance of time. Active state does not remain constant throughout the contraction, but waxes and wanes, so that the force-velocity curve, which has a shape like that in Fig. 11.10, represents properties at only one instant; it has grown from the origin following stimulation of the muscle, and will collapse back into it as the active state decays. The graphs relating force, velocity, and length are all moving with respect to their axes during the contraction and relaxation of the muscle.
This kind of description has some value both in illustrating the complications that exist and in showing that however we examine a contraction (whether in terms of velocity or force) there are two main influences at work in deciding its level. The first is the length of the muscle element, and the second is the intensity of the active state. The importance of this latter property is worth stressing; it is easy to see intuitively that a high level of active state will, other things being equal, produce a stronger contraction - however measured. But it is much less easy to see how to express or measure this level, and in many situations we find that there is a property of the muscle—usually termed 'contractility' - which is not precisely measurable or definable. Even if we confine attention to the isolated muscle preparation there are a number of areas still in dispute. These are mainly related to the form of the 'edges' of the three-dimensional surface which is needed to describe graphically the inter-relations between force, velocity, and length described above, which cannot always be described directly from experimental evidence, but only by extrapolation. Such extrapolation must be based on a model of the muscle (such as Fig. 11.11 (b) or (c), or some more complicated variant) and the result may be crucially dependent upon which model is chosen.
One example, which has important practical implications, will serve to illustrate the problem. It concerns the maximum velocity of shortening which can be achieved by the unloaded contractile element. This velocity (known as Vmax) cannot be measured directly in cardiac muscle because, as shown in Fig. 11.9, there is finite tension at all lengths in resting cardiac muscle, and therefore there has always to be a load (the preload) present to set the initial length. Thus Vmm can only be established by extrapolation. Some years ago, the American physiologist E. H. Sonnenblick performed this extrapolation on force-velocity curves measured at a series of different muscle-lengths, and concluded that it was possible to extrapolate all the curves (which are shown in Fig. 11.14) to a common intercept on the velocity axis.
Thus Vmax appeared to be independent of muscle-length. This suggestion stimulated great interest because it implied that Vmax might be used to distinguish between the effects which changes in length and in active state intensity (i.e. contractility) have on muscle performance. It will already be clear how useful such a measure would be in isolated muscle experiments; but in examining the performance of the whole heart chamber, where the difficulties of controlling and monitoring these separate influences increase, it would be even more valuable.
However, there are problems in performing the extrapolation which gives Vmnx,
because some shape has to be assumed for the force-velocity curve which is being
extrapolated, and it is in choosing this that the muscle model becomes
important. Now Hill's model of muscle (Fig. 11.11 (a)) is inappropriate, because
in the heart there is resting tension, so it becomes necessary to correct the
measured data, to allow for the effect of a parallel elastic element, before
extrapolating. The details of this can be found elsewhere;![]() it suffices here to
say that the corrections needed depend upon which form of model is used (Fig.
11.11 (b) or (c)) being the simplest possibilities), and affect the values
derived for Vmsa. This means that the original hypothesis that Vmax was
independent of initial length, which was based on extrapolation of the curves in
Fig. 11.14 to a common origin on the velocity axis, may be true only as a
special case, and the length-velocity relationship at zero load has once more
become a subject of dispute. During the decade or so in which these simple mechanical models have been
used in cardiac research, much of the detailed ultrastructure of skeletal muscle
has been described, and elegant techniques developed for making measurements at
the sarcomere level. Increasingly, the mechanical properties of skeletal muscle
are being interpreted in relation to the known structure of the contractile
apparatus; thus the sarcomere has become the model. So far, a lack of suitable
preparations has prevented this in cardiac muscle research, and the mechanical
models continue to be the only useful analogy to real cardiac muscle at present.
it suffices here to
say that the corrections needed depend upon which form of model is used (Fig.
11.11 (b) or (c)) being the simplest possibilities), and affect the values
derived for Vmsa. This means that the original hypothesis that Vmax was
independent of initial length, which was based on extrapolation of the curves in
Fig. 11.14 to a common origin on the velocity axis, may be true only as a
special case, and the length-velocity relationship at zero load has once more
become a subject of dispute. During the decade or so in which these simple mechanical models have been
used in cardiac research, much of the detailed ultrastructure of skeletal muscle
has been described, and elegant techniques developed for making measurements at
the sarcomere level. Increasingly, the mechanical properties of skeletal muscle
are being interpreted in relation to the known structure of the contractile
apparatus; thus the sarcomere has become the model. So far, a lack of suitable
preparations has prevented this in cardiac muscle research, and the mechanical
models continue to be the only useful analogy to real cardiac muscle at present.
Summary. Before we go on to consider the behaviour of the intact heart-chamber, it is useful to summarize some of the findings on isolated muscle preparations. Such muscles contain considerable numbers of muscle-cells, probably all lying reasonably parallel with the long axis. At rest, and over what can be assumed to be their normal operational length range, they resist stretching with a force which rises steeply with increasing length. The structural element responsible for this property has not been identified; in conceptual models it is called the parallel elastic element, and thought of as a spring (though a simple spring is actually a poor representation of the real situation, since the muscle does not oscillate when it is released, and exhibits a good deal of creep when it is stretched; both these imply viscous as well as elastic properties). Cardiac muscle-cells can be depolarized by an externally applied shock, and this depolarization is followed, after a delay of some milliseconds, by a period of mechanical activity during which the muscle will shorten. If it is loaded to resist shortening then it develops tension, and shortens if and when tension matches the load; the velocity of shortening is then inversely related to the load moved. The ability of the muscle to pull and shorten undoubtedly resides in the structures in the sarcomere, whose length is closely proportional to muscle-length over a considerable range. However, the details of the shortening mechanism are unresolved, so again a conceptual model is used, comprising the contractile element, which shortens on stimulation, and is connected to the load (if any) via a series elastic element. The magnitude of force and velocity generated by the muscle increases, in the physiological range, with muscle-length; thus a family of force-velocity curves are needed to describe contractions starting from different lengths. Beyond a certain length, which probably corresponds to some optimal alignment of the protein filaments in the sarcomere, further stretching produces a decline in the force generated by a contraction; but this probably lies outside the normal range of lengths in the intact heart. The individual sarcomere will apparently shorten by a maximum of about 30 per cent, from a resting length of approximately 2-2 mm down to 1-5 mm; but such measurements may be imprecise due to distortion during histological preparation. The time-course of contractility of the muscle is limited, as is its intensity. For practical purposes, these limits are probably well described by the isometric twitch response, and both are susceptible to a number of environmental influences. Influences which affect the time-course of cardiac contraction (i.e. heart-rate) are known as chronotropic; and those which affect its magnitude as inotropic. Inotropic influences include a number of chemical agents, such as hormones, drugs, and ions, which may increase or decrease the contractility and are likely to be of great significance in control of the intact heart.